by Carol Fey
 Troubleshooting
charts help you start at the beginning and not skip steps.image
courtesy www.rfcafe.com 2004Ah, the troubleshooting chart. Eyes
glaze over. Naps begin. But that’s just because most folks don’t
know how to read them. If they did, well they’d be absolutely
enchanted with all the information available in such an organized
way!
Techies are often very linear thinkers. Linear means straight
line, cause and effect. We like it when we can be certain: “This
happens, then this happens, and only then does this happen.”
Doesn’t that sound like the perfect world? Doesn’t that sound
a lot easier to deal with than, “There are a lot of things going
on all at once and we’re not sure why”?
A troubleshooting chart transforms you from the squirmy uncertainty
of random parts-changing to a world of clear thinking. It was
made for technicians! That’s why it’s the way it is.
So for all of you who haven’t yet learned the joys of the troubleshooting
chart, let me explain how it works.
A troubleshooting chart is a flow chart. It shows a sequence
of steps in a particular order. There are a few simple rules:
You must start at the beginning. You may not start in the middle,
even if that seems like the right place. You may not skip steps,
even if you think they’re silly. Although we mostly don’t like
rules, these are a small price to pay for getting to the right
answer with a minimum of pain.
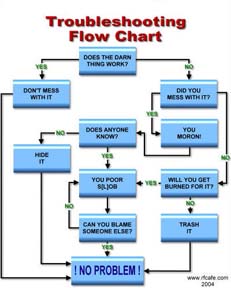
Here’s a fun nontechnical troubleshooting chart. It certainly
isn’t an example of the best way to be, but it gets a chuckle
out of most of us. Try it to see how a troubleshooting chart
works.
In a troubleshooting chart, the pattern is:
-
A question or statement.
-
A choice of yes or no.
-
An action to take or a new question, depending upon the yes
or no choice.
Start at the top. Here we go.
The first question on this humorous chart is, “Does the thing
work?”
You choose “yes” or “no.”
Choosing “yes” takes you to the action, “Don’t mess with it,”
and on down to the final resolution, “No problem.”
Choosing “no” takes you to a new question, “Did you mess with
it?”
The answer “yes” takes you to a piece of information (“You fool”)
and to a new question, “Does anyone know?”
Again there are two possible answers to the question. Those
lead in two possible directions. The answer “no” leads to an
instruction, “Hide it,” and to the final resolution, “No problem.”
Choosing “yes” for the question leads down an entirely different
path. There’s the piece of information (“You poor fool”) and
a new question, “Can you blame someone else?”
If you can answer “yes,” you move on to the resolution, “No
problem.”
The answer “no” leads back to “You poor fool,” and back to “Can
you blame someone else?” and so on in a pattern called an infinite
loop. You just keep going around and around. A real troubleshooting
chart shouldn’t have any infinite loops in it. But seeing it
in this one feels a little like real life, doesn’t it? The lesson
is that you can’t get out of the loop until you answer the question
“yes.” Then you can move on to “No problem.”
Let’s go back up to the top of the chart and take the remaining
path — the “no” answer to “Did you mess with it?”
Following the “no” answer is the question, “Will you get in
trouble?”
A “yes” answer to “Will you get in trouble?” takes us to the
piece of information “You poor fool.” We’ve already seen the
rest of that path.
Moving back up to the “no” answer to “Will you get in trouble?”
there’s only one piece of information, “Forget about it!” and
that moves directly on to “No problem.”
The method of using a real troubleshooting chart is the same.
You have to start at the beginning. The answers you give to
the questions determine where you move next in the chart. Eventually
the chart leads you to the resolution of the problem.Using A
Troubleshooting Chart
One of the biggest troubleshooting challenges in the heating
business is electronic burner ignition. The challenge doesn’t
come from the controls themselves, which usually aren’t the
source of the problem.
The troubleshooting problem comes from the fact that electronic
systems don’t necessarily “think” the way we humans do. When
we try to use only our human “logic,” it’s easy to get the wrong
answer.
A classic is when the gas burner won’t light. There’s a pilot,
but the valve won’t open to light the burner. Human logic says
if there’s gas for the pilot, then there’s gas available for
the burner. If that gas won’t come out of the valve, then it’s
gotta be a faulty valve.
Replace the valve. The system still doesn’t work. Human logic
says then the problem has to be the ignition module. Replace
that. The system still doesn’t work.
Manufacturers say that of the products they take back on warranty,
the majority have nothing wrong with them. They take them back
to earn your good will. What they can’t do for you is replace
the time (translate “money”) you spent replacing something that
wasn’t defective.
Let’s take a moment and consider why changing parts sometimes
works. Many of the problem jobs, especially on new installations,
are faulty wiring. If you change enough parts enough times,
chances are you’ll eventually get the wiring right — even if
you never knew that it was wrong in the first place.
Following a troubleshooting chart lets us see the logic of the
system. That’s called the “sequence of operation.” It’s not
only that we may not know how things are normally supposed to
work. It may also be that they work differently than we would
have assumed.
The chart also keeps us from forgetting steps. It may say something
as simple as “Turn it on.” On the one hand we may think, “Duh,
what a stupid thing to say.” On the other hand, I’ve embarrassed
myself more than once by forgetting that step. That’s why we
start at the very beginning.
And the chart keeps us from making assumptions. For example,
we may assume that, of course, there’s a call for heat. It can
save hours of time, though, to have the troubleshooting chart
ask, “Call for heat from thermostat?” Having to answer “yes”
or “no” is a painless reminder to check the thermostat just
to be sure.
Keeping in mind the fun of the troubleshooting chart I gave
you, pull out a troubleshooting chart for a control or other
equipment that you work with. Does it look different now? |